Summary:
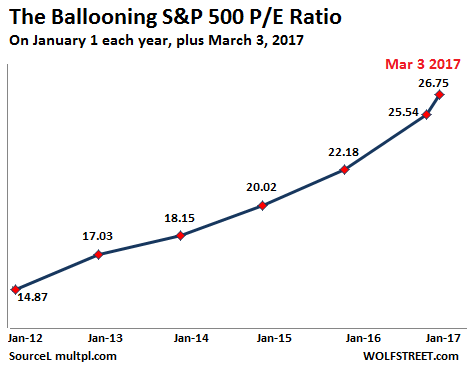
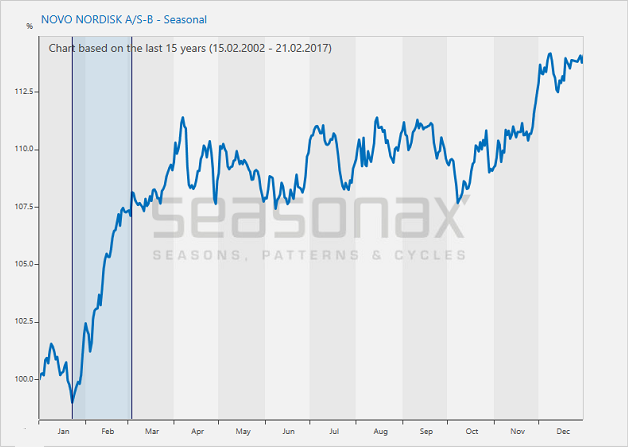
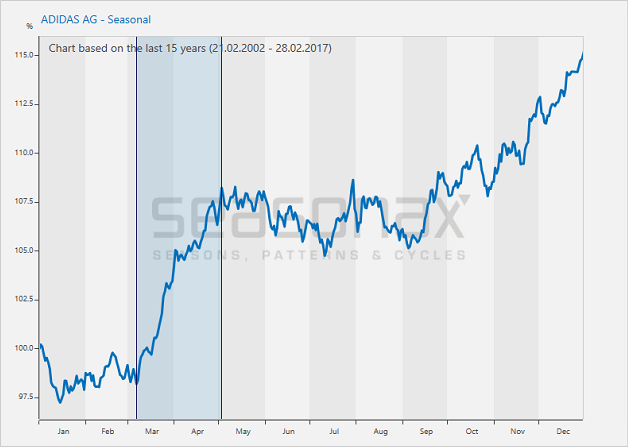
Systematic Trading Based on Statistics Trading methods based on statistics represent an unusual approach for many investors. Evaluation of a security’s fundamental merits is not of concern, even though it can of course be done additionally. Rather, the only important criterion consists of typical price patterns determined by statistical examination of past trends. Systematic trading on the basis of statistical evidence will improve the odds of generating profits. Trading based on seasonality does in fact represent such a statistically substantiated trading approach. Ballooning S&P 500, Jan 2012 - 2017Fundamental considerations such as the valuation of stocks are not really relevant to the statistics-based trading approach discussed here. This is not to say that they are not important as such – one should certainly be aware of the fundamental backdrop. The point is only that strategies based on e.g. seasonality have a different focus. - Click to enlarge Seasonality Helps with Stock Selection Everybody has probably heard about the end-of-year rally phenomenon by now. It affects the majority of stocks during the same time period, namely in the final weeks of the year. However, many people are probably unaware that individual stocks display unique seasonal patterns as well.
Topics:
Dimitri Speck considers the following as important: Debt and the Fallacies of Paper Money, Featured, newsletter, The Stock Market
This could be interesting, too:
Nachrichten Ticker - www.finanzen.ch writes Die Performance der Kryptowährungen in KW 9: Das hat sich bei Bitcoin, Ether & Co. getan
Nachrichten Ticker - www.finanzen.ch writes Wer verbirgt sich hinter der Ethereum-Technologie?
Martin Hartmann writes Eine Analyse nach den Lehren von Milton Friedman
Marc Chandler writes March 2025 Monthly
Conclusion
I am strongly convinced that trading strategies based on seasonal trends in individual securities still offer plenty of unexploited potential to generate outperformance.
Charts by: Wolfstreet, Seasonax
Tags: Featured,newsletter,The Stock Market


