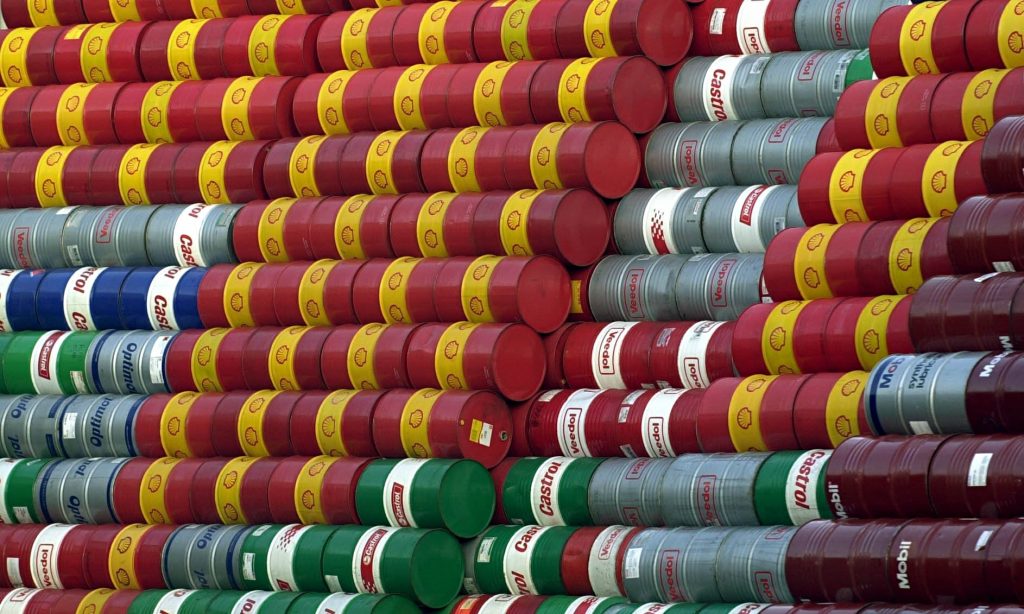
Endangered Recovery As we noted in a recent corporate debt update on occasion of the troubles Neiman-Marcus finds itself in (see “Cracks in Ponzi Finance Land”), problems are set to emerge among high-yield borrowers in the US retail sector this year. This happens just as similar problems among low-rated borrowers in the oil sector were mitigated by the rally in oil prices since early 2016. The recovery in the oil sector seems increasingly endangered though. Too many oil barrels are filling up again. Photo credit: Kay Nietfeld / DPA / Corbis - Click to enlarge Here is a chart we have frequently shown in the past, which illustrates the y/y change rate in commercial & industrial loan charge-offs plus delinquencies in comparison to junk bond yields (the federal funds rate is added for good measure): . To avoid misinterpretations of this chart, note that the big surge in the rate of change of charge-offs/delinquencies obviously started from very low levels. In absolute terms it came nowhere near to the levels that were seen in 2008 – 2009. Both the increase in charge-offs and delinquencies and the improvement over recent quarters closely tracked the problems and subsequent recovery in the oil & gas sector as the oil price plunged from late 2014 to early 2016 and then rebounded.
Topics:
Pater Tenebrarum considers the following as important: Chart Update, commodities, Debt and the Fallacies of Paper Money, Featured, newsletter
This could be interesting, too:
Nachrichten Ticker - www.finanzen.ch writes Die Performance der Kryptowährungen in KW 9: Das hat sich bei Bitcoin, Ether & Co. getan
Nachrichten Ticker - www.finanzen.ch writes Wer verbirgt sich hinter der Ethereum-Technologie?
Martin Hartmann writes Eine Analyse nach den Lehren von Milton Friedman
Marc Chandler writes March 2025 Monthly
Endangered RecoveryAs we noted in a recent corporate debt update on occasion of the troubles Neiman-Marcus finds itself in (see “Cracks in Ponzi Finance Land”), problems are set to emerge among high-yield borrowers in the US retail sector this year. This happens just as similar problems among low-rated borrowers in the oil sector were mitigated by the rally in oil prices since early 2016. The recovery in the oil sector seems increasingly endangered though. |
|
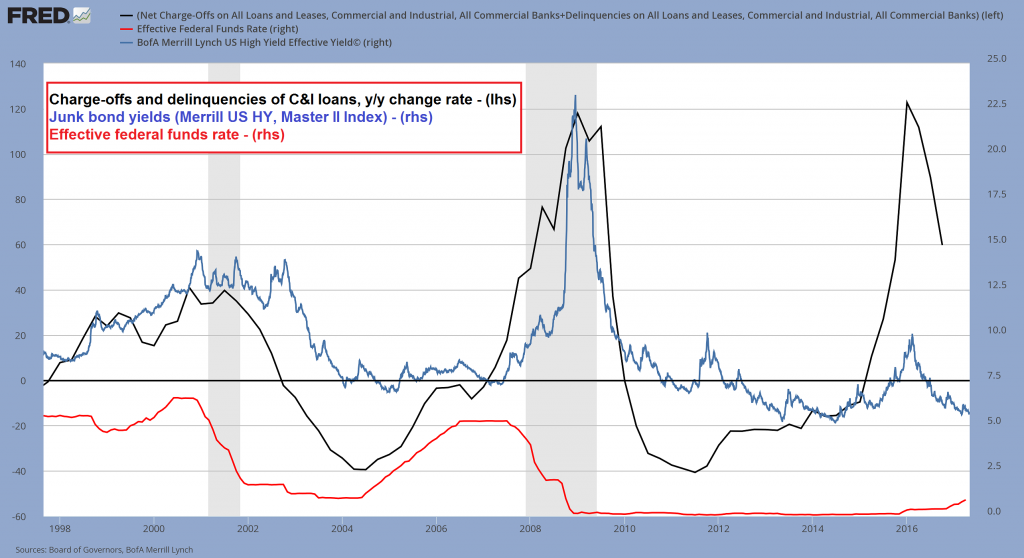
| Here is a chart we have frequently shown in the past, which illustrates the y/y change rate in commercial & industrial loan charge-offs plus delinquencies in comparison to junk bond yields (the federal funds rate is added for good measure): | |
| To avoid misinterpretations of this chart, note that the big surge in the rate of change of charge-offs/delinquencies obviously started from very low levels. In absolute terms it came nowhere near to the levels that were seen in 2008 – 2009. Both the increase in charge-offs and delinquencies and the improvement over recent quarters closely tracked the problems and subsequent recovery in the oil & gas sector as the oil price plunged from late 2014 to early 2016 and then rebounded.
Whether the expected surge in retail sector defaults this year will have an impact on this statistic remains to be seen of course. The surge in junk bond yields from the 2014 lows to the early 2016 highs and the subsequent decline close to previous lows were likewise largely related to the energy sector, which is home to a great many junk-rated borrowers. They happen to borrow quite tidy sums as well, so these developments are not inconsequential from a wider economic perspective. In recent years US capital spending growth and data reported by the manufacturing sector (especially by producers of capital goods) appeared to be quite closely correlated with the fate of the oil sector as well, or more precisely, the fate of the fracking industry. All of this must be brought into context with monetary policy. Large increases in the money supply and the associated decrease in interest rates tend to drive up prices of factors in the higher stages of the production structure, i.e., those that are temporally distant from the consumer goods stage. As an aside to this, readers may wonder why the retail industry is facing problems if that is so – to this one has to keep in mind that over-consumption is a feature of the boom as well, as is the fact that investment is derailed into the wrong lines. These are the factors affecting the retail sector. The main “beneficiaries” of the boom are always specific sectors of the economy, which absorb a particularly large share of investment financed by newly created money and credit. Which sectors precisely depends on contingent circumstances (e.g. the fracking industry benefited from the perception that China would boost global oil demand and from technological advances that made fracking viable). In hindsight we can state that the oil industry’s problems did not suffice to derail the slow-motion economic recovery, as money supply growth remained strong and other sectors took up the slack. However, as we have pointed out on several occasions in recent weeks, money and credit growth are now faltering (See “The Triumph of Hope over Experience” for recent money supply charts). |
|
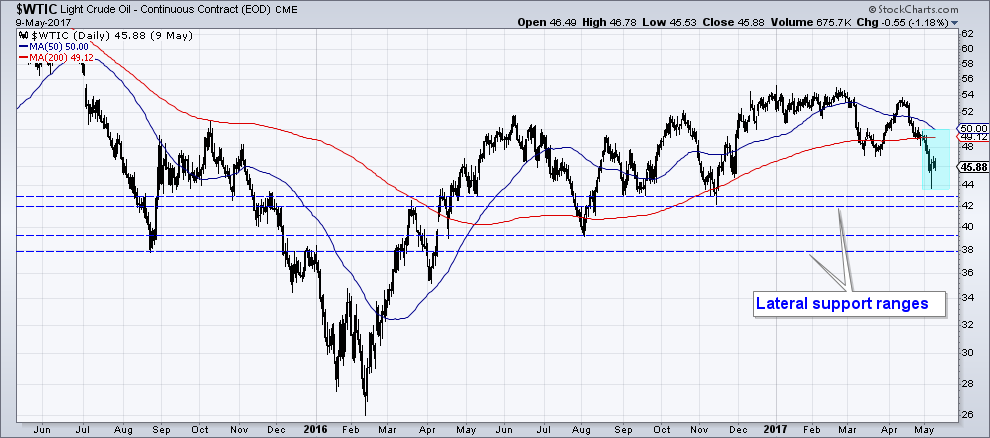
| Light sweet crude oil, daily, over the past two years. Recently prices have declined well below both the 50 and 200 day moving average, for the first time since moving above them in 2016 (see the bluish rectangle). Crude oil is now approaching an initial range of lateral support. Should it fail to halt the decline, the next support range awaits between roughly $38 to $40. Below ~$40 a large amount of shale production is reportedly not viable, despite ongoing advances in extraction technology – click to enlarge.
As the chart above indicates, the recovery in the oil sector could soon be in jeopardy. Oil prices have declined noticeably in recent weeks, and even though major support levels haven’t been breached yet, the decline is more concerning from a technical perspective than previous corrections were, due to the movement of prices relative to important moving averages. There is more to this though, as the market structure gives cause for concern as well (more on this further below). |
|
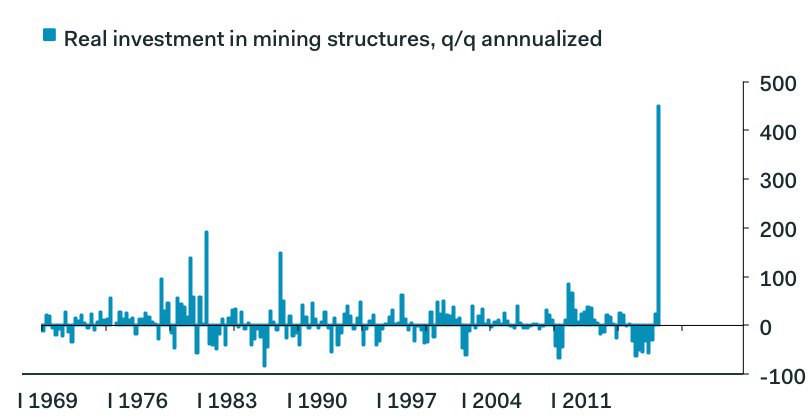
Self-Defeating EnthusiasmAs we were pondering likely developments in the sector, we came across a tweet by Ian Shepherdson from the end of April on an interesting detail in the Q1 GDP report. Given the previous sharp decline in the rig count, this surge in investment into new oil wells comes off very low levels as well of course, so it is probably not as impressive in absolute terms. What it illustrates though is that any rally in the oil price very quickly leads to sizable increases in the production of shale oil. This is not surprising, as the troubled debtors in the sector still have to produce as much as they can to keep servicing their debt. This holds also for companies that have successfully restructured their debt in the past year or so – if one looks at the details of these restructuring efforts, many have only provided a very limited increase in flexibility, and usually at great cost. The extremely fast decline rates of shale production wells play into this as well of course, but that can hardly be seen as a positive factor, even if it is putting a small brake on the overall surge in supply. In chart form the Q1 surge in investment in oil drilling looks quite daunting – it can probably be seen as a symptom of the self-defeating nature of this cycle, since it lowers the probability that current oil prices will be maintained or that an even bigger rally will emerge. To be sure, all of that could change dramatically once the trend in monetary policy turns toward loosening rather than tightening again. As we have often pointed out, one must always keep monetary factors in mind when analyzing commodity prices. Supply and demand related to commodities themselves are very important, but they are not everything. Any material change in market perceptions regarding the future purchasing power of money will affect their prices as well – but such changes in “price inflation” expectations may do little to improve the margins of producers, as their input costs are liable to increase just as fast in that case (leads and lags may create a temporarily favorable situation, but if so, it won’t last long). Even coming off a low base, the increase in spending on oil drilling in Q1 is astonishing. The relatively strong showing of manufacturing PMIs in recent months was very likely influenced by this as well. That brings us to another part of the oil market in which way too much enthusiasm is in evidence. |
Real Investment In Mining Structiresm 1969 - 2017 |
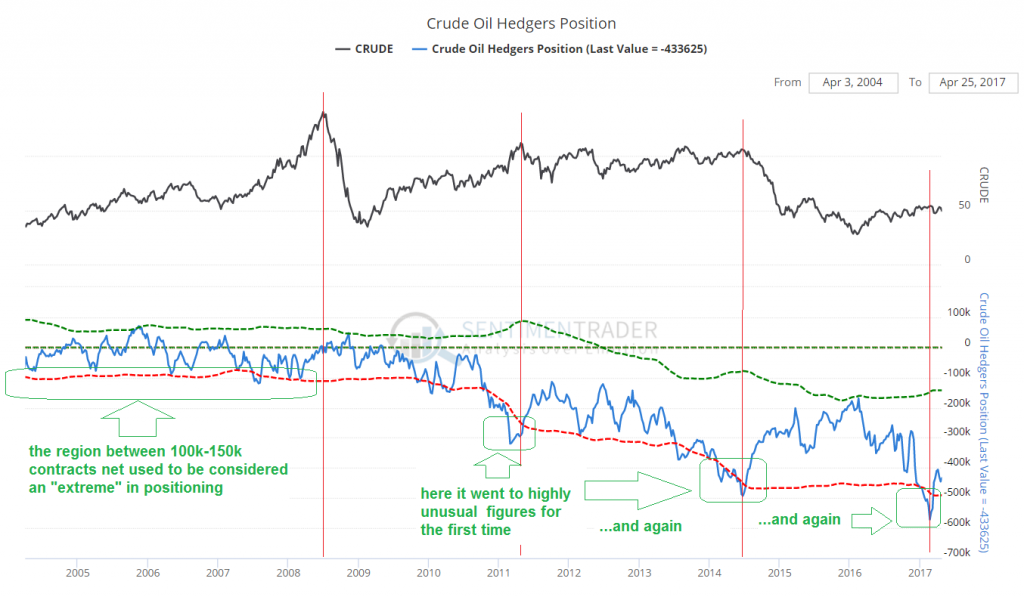
Ominous Market StructureBack in 2014 we kept wondering about the huge surge in net speculative long positions in WTIC futures. We considered the possibility that they may partly have reflected arbitrage intended to capture movements in the spread between WTIC and Brent, but we couldn’t find any really convincing evidence for this. Generally there has been an explosion in speculative positioning records across all tradable instruments in the post-GFC era, which we ultimately attribute to the unremitting flood of central bank-created liquidity (this is also affecting trends in CLO and leveraged loan markets, which we will take a look at next). For much of 2014 the large net long position held by speculators seemed not to matter, as crude oil prices remained firm. But it turned out that the latent threat such a position represents was very real once the trend changed and prices violated important technical levels. The recent situation is not merely just as bad, it is actually worse. Below is a long term chart of the net hedger position (the inverse of the combined speculative position) illustrating the succession of extreme readings since 2008. Net position of hedgers in WTIC futures (the inverse of the net speculative position). Once upon a time, a net position of 100k-150k contracts was considered huge and a sign that caution was warranted. These records have long been left in the dust. Note that even after the recent reduction in the net position, we are currently not far from the most extreme levels of 2014, shortly before the market tanked. The red vertical lines are aligned with price highs in crude oil. Often the size of the net position will decrease shortly before prices peak. This was very much evident in 2008 when oil entered the blow-off stage of the bull market. It actually succeeded in mowing down at least one large commercial hedger, as the company was no longer able to service its margin calls (it had off-setting inventory, but margin calls require one to put up cash immediately, and getting hold of cash in 2008 was at times difficult). At the 2014 secondary peak just before the market slumped, the net position and prices peaked at the same time though – click to enlarge. One thing that stands out to us in the context of the rebound since early 2016, is that a lot of speculative “firepower” was expended in what is actually a rather middling price rally with very little momentum apart from its initial phase. Between November 2016 and February 2017 the speculative position more than doubled, with speculators adding nearly 300,000 contracts net, which resulted in moving prices from around $47/ bbl. to $54/bbl. Although this big commitment of money has not exacty produced a gain worth writing home about, the huge net position now hangs over the market like the sword of Damocles. |
Crude Oil Hedgers Position, 2005 - 2017 |
ConclusionIt is of course possible that the market will prove resilient for a while and remain in a trading range a little longer, similar to the situation in much of 2014. We would be concerned though given the slowdown in money supply and credit growth that important support levels will eventually be breached. Once that happens, there can be little doubt that much of the large speculative position will be liquidated and prices will cascade lower just as they did in 2014. In that case one would have to bid adieu to the brief period of relief in this sector of junk-bond land as well. If – as seems likely – other sectors get into trouble concurrently, a broader change in perceptions will take hold. For instance, worries about the supply of corporate debt being “too small” have been frequently voiced of late (no kidding!), as speculation in all sorts of structured products and junk bonds heats up and spreads are compressed to unheard of levels. We suspect such worries are bound to evaporate in a flash, along with the recent surfeit in liquidity. Stay tuned, more on this topic is coming soon. |
Tags: Chart Update,commodities,Featured,newsletter

