USD/CHF is correcting back after peaking as it extends its uptrend. The pair will probably resume its bullish bias after the pull back has completed. USD/CHF is pulling back within its short-term uptrend after peaking at 0.8642 on Monday. The move is only likely to be a temporary correction, however, before the pair resumes its uptrend and extends its sequence of higher highs and higher lows. USD/CHF 4-hour Chart USD/CHF will probably reach the target generated after it broke out of the range, at 0.8680, the 100% Fibonacci (Fib) extrapolation of the height of the range higher. It has already met the conservative target at 0.8627, the 61.8% Fib level. The Relative Strength Index (RSI) has exited the overbought region giving traders a
Topics:
Joaquin Monfort considers the following as important: 1.) FXStreet on SNB&CHF, 1) SNB and CHF, Featured, newsletter
This could be interesting, too:
Nachrichten Ticker - www.finanzen.ch writes Die Performance der Kryptowährungen in KW 9: Das hat sich bei Bitcoin, Ether & Co. getan
Nachrichten Ticker - www.finanzen.ch writes Wer verbirgt sich hinter der Ethereum-Technologie?
Martin Hartmann writes Eine Analyse nach den Lehren von Milton Friedman
Marc Chandler writes March 2025 Monthly
- USD/CHF is correcting back after peaking as it extends its uptrend.
- The pair will probably resume its bullish bias after the pull back has completed.
USD/CHF is pulling back within its short-term uptrend after peaking at 0.8642 on Monday. The move is only likely to be a temporary correction, however, before the pair resumes its uptrend and extends its sequence of higher highs and higher lows.
USD/CHF 4-hour Chart
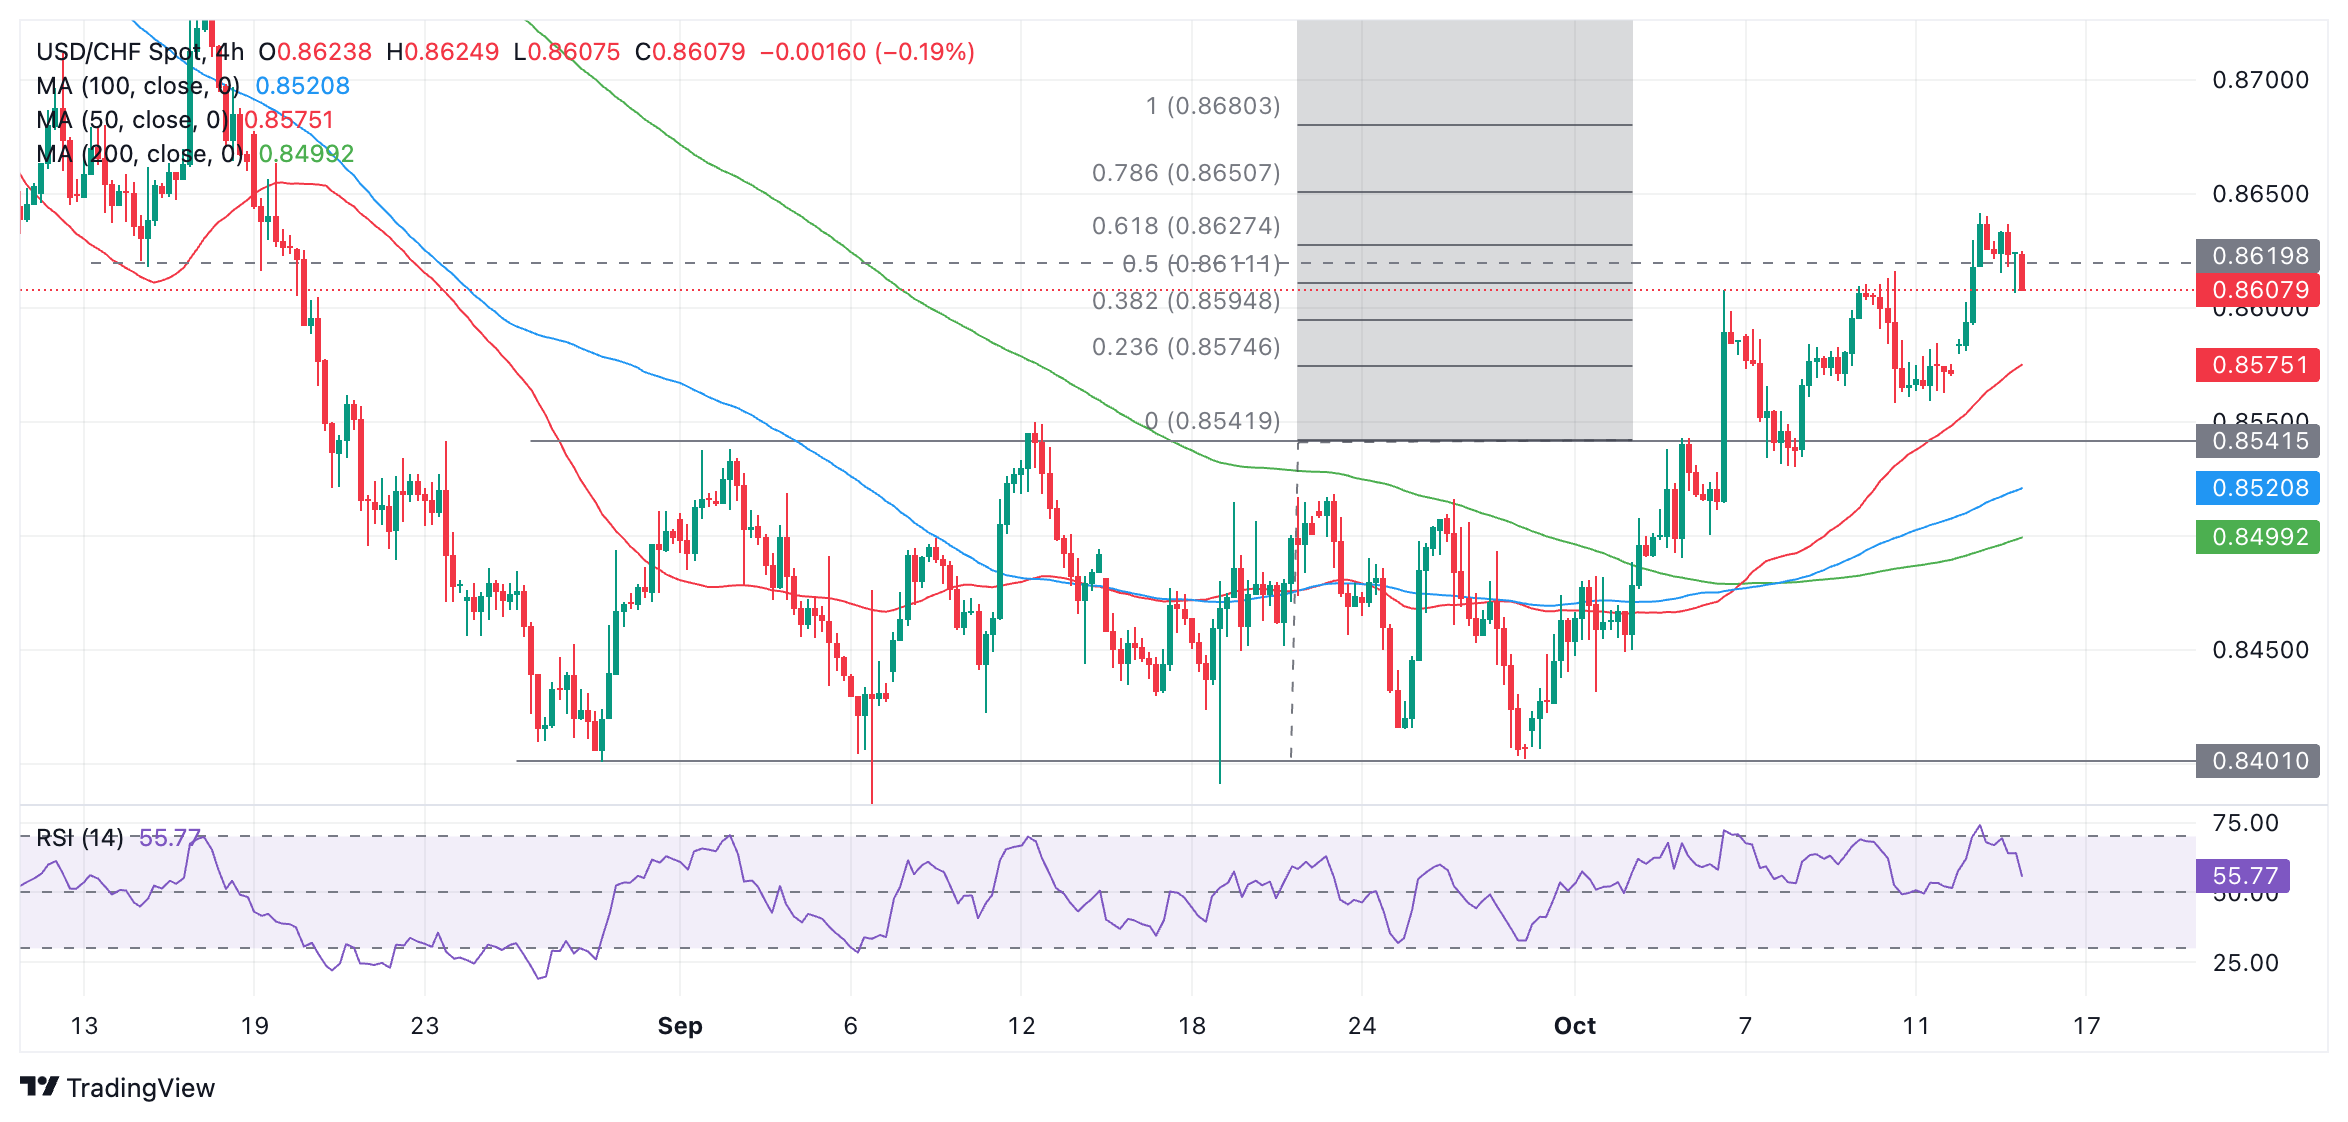
USD/CHF will probably reach the target generated after it broke out of the range, at 0.8680, the 100% Fibonacci (Fib) extrapolation of the height of the range higher. It has already met the conservative target at 0.8627, the 61.8% Fib level.
The Relative Strength Index (RSI) has exited the overbought region giving traders a signal to liquidate their long positions and sell short.
A chart gap opened on Monday morning and there is a risk the market could pull back all the way to fill this gap. If so, it could correct down to 0.8574. It would require a break below the former range highs at 0.8541 to confirm a probable change of trend.
Tags: Featured,newsletter