Money supply growth fell again in January, falling even further into negative territory after turning negative in November 2022 for the first time in twenty-eight years. January's drop continues a steep downward trend from the unprecedented highs experienced during much of the past two years. Since April 2021, money supply growth has slowed quickly, and since November, we've been seeing the money supply contract for the first time since the 1990s. The last time the year-over-year (YOY) change in the money supply slipped into negative territory was in November 1994. At that time, negative growth continued for fifteen months, finally turning positive again in January 1996. During January 2023, YOY growth in the money supply was at –5.04 percent. That's down from
Topics:
Ryan McMaken considers the following as important: 6b) Mises.org, Featured, newsletter
This could be interesting, too:
Nachrichten Ticker - www.finanzen.ch writes Die Performance der Kryptowährungen in KW 9: Das hat sich bei Bitcoin, Ether & Co. getan
Nachrichten Ticker - www.finanzen.ch writes Wer verbirgt sich hinter der Ethereum-Technologie?
Martin Hartmann writes Eine Analyse nach den Lehren von Milton Friedman
Marc Chandler writes March 2025 Monthly
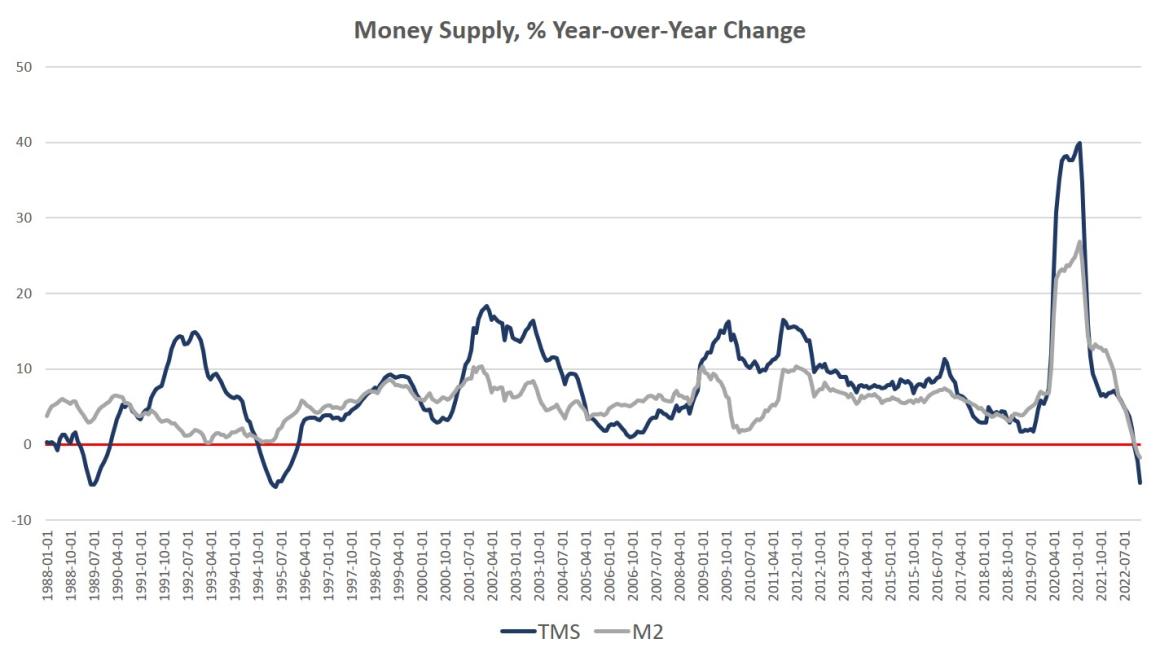
Money supply growth fell again in January, falling even further into negative territory after turning negative in November 2022 for the first time in twenty-eight years. January's drop continues a steep downward trend from the unprecedented highs experienced during much of the past two years.
Since April 2021, money supply growth has slowed quickly, and since November, we've been seeing the money supply contract for the first time since the 1990s. The last time the year-over-year (YOY) change in the money supply slipped into negative territory was in November 1994. At that time, negative growth continued for fifteen months, finally turning positive again in January 1996.
During January 2023, YOY growth in the money supply was at –5.04 percent. That's down from December's rate of –02.19 percent and down from January 2022's rate of 6.82 percent. With negative growth now dipping below -5 percent, money-supply contraction is approaching the biggest declines we've seen in the past thirty-five years. Only during brief periods of 1989 and 1995 did the money supply fall as much. At no point for at least sixty years has the money supply fallen by more than 5.6 percent in any month.
The money supply metric used here—the "true," or Rothbard-Salerno, money supply measure (TMS)—is the metric developed by Murray Rothbard and Joseph Salerno, and is designed to provide a better measure of money supply fluctuations than M2.
The Mises Institute now offers regular updates on this metric and its growth. This measure of the money supply differs from M2 in that it includes Treasury deposits at the Fed (and excludes short-time deposits and retail money funds).
In recent months, M2 growth rates have followed a similar course to TMS growth rates, although TMS has fallen faster than M2. In January 2023, the M2 growth rate was –1.76 percent. That's down from December's growth rate of –1.16 percent. January's rate was also well down from January 2022's rate of 11.6 percent.
Money supply growth can often be a helpful measure of economic activity and an indicator of coming recessions. During periods of economic boom, money supply tends to grow quickly as commercial banks make more loans. Recessions, on the other hand, tend to be preceded by slowing rates of money supply growth. However, money supply growth tends to begin growing again before the onset of recession.
Negative money supply growth is not in itself an especially meaningful metric. But the drop into negative territory we've seen in recent months does help illustrate just how far and how rapidly money supply growth has fallen in recent months. That is generally a red flag for economic growth and employment.
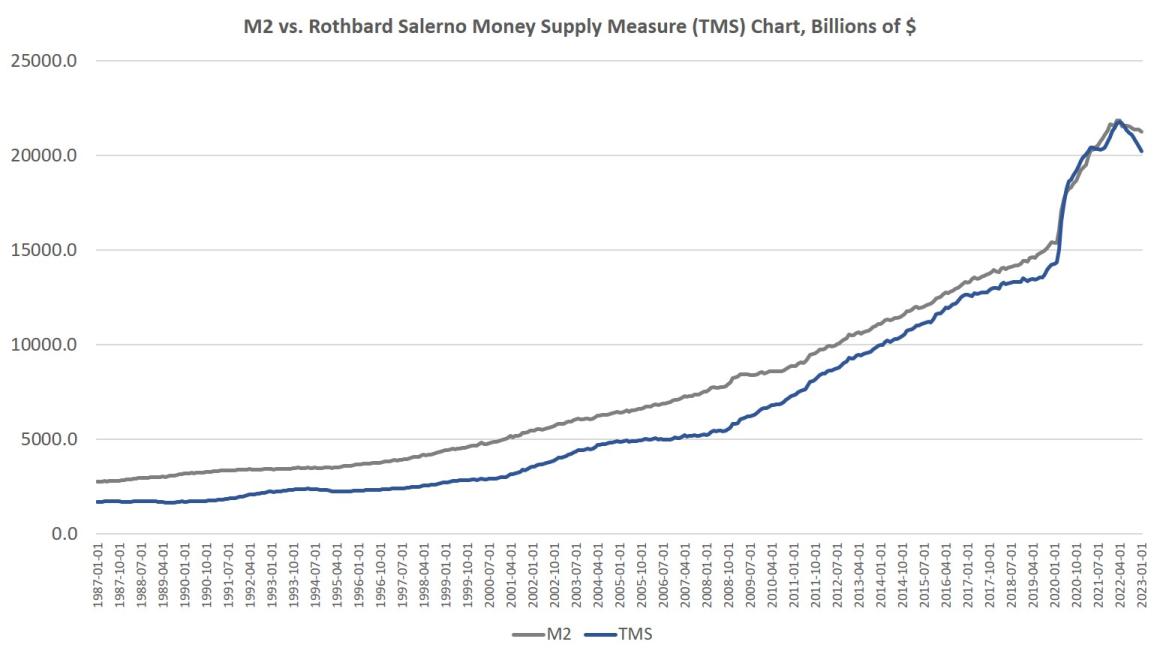
The fact that the money supply is shrinking at all is so remarkable because the money supply almost never gets smaller. It is important to keep some perspective, however, on just how much the money supply has shrunk compared to overall growth. The money supply has now fallen by $1.5 trillion since the peak in April 2022. In raw numbers, that's certainly the largest fall we've seen. But we can see in the next graph why, in percentage terms, the drop doesn't beat those of the late 80s and early 90s. Money creation since 2009—and especially since 2020—has been so large that even a drop of $1 trillion is not especially momentous. Rather, the money supply would have to drop another $5 trillion or so—or more than 25 percent—just to return to the pre-2009 trend.
In fact, since 2009, the TMS money supply has grown by 203 percent. (M2 has grown by 151 percent in that period.) Out of the current money supply of $20.2 trillion, $5.9 trillion of that has been created since January 2020—or 29%. Since 2009, $13.5 trillion of the current money supply has been created. In other words, two-thirds of the money supply have been created over the past 13 years.
With these kinds of totals, a five percent drop puts only a small dent in the huge edifice of newly created money. The US economy still faces a very large monetary overhang from the past several years, and this is partly why after nine months of slowing money-supply growth, we are not yet seeing a sizable slowdown in the labor market, or even in consumption.
Nonetheless, the monetary slowdown has been sufficient to considerably weaken the economy. Home prices have fallen. Credit card debt has soared, consumer loan delinquencies are up, job openings are falling, and the manufacturing outlook is falling.
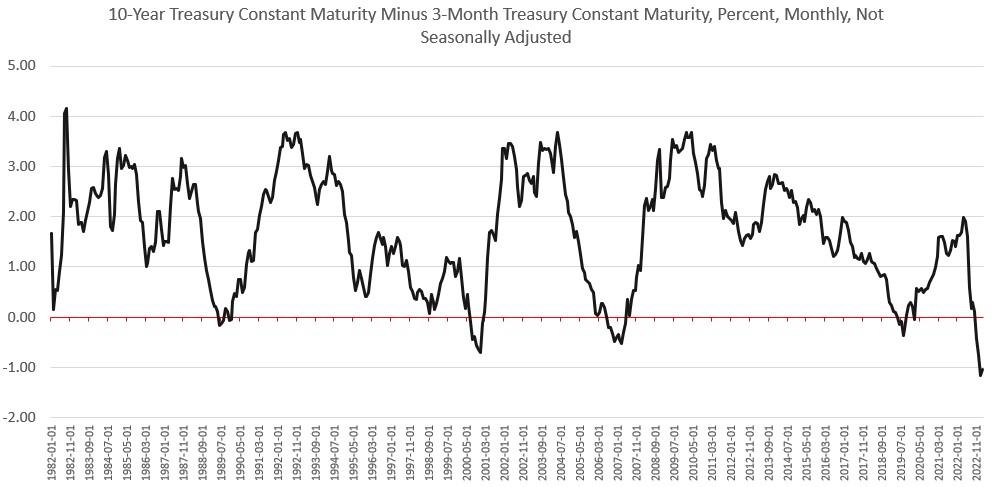
Money supply growth also appears to be connected to yield-curve inversion—itself a recession indicator. For example, the 3s/10s yield spread often heads toward zero as money supply growth moves in the same direction. This was especially clear from 1999 through 2000, from 2004 to 2006, and during 2018 and 2019, and beginning in 2022. This is not surprising because trends in money supply growth have long appeared to be connected to the shape of the yield curve. As Bob Murphy notes in his book Understanding Money Mechanics, a sustained decline in TMS growth often reflects spikes in short-term yields, which can fuel a flattening or inverting yield curve.
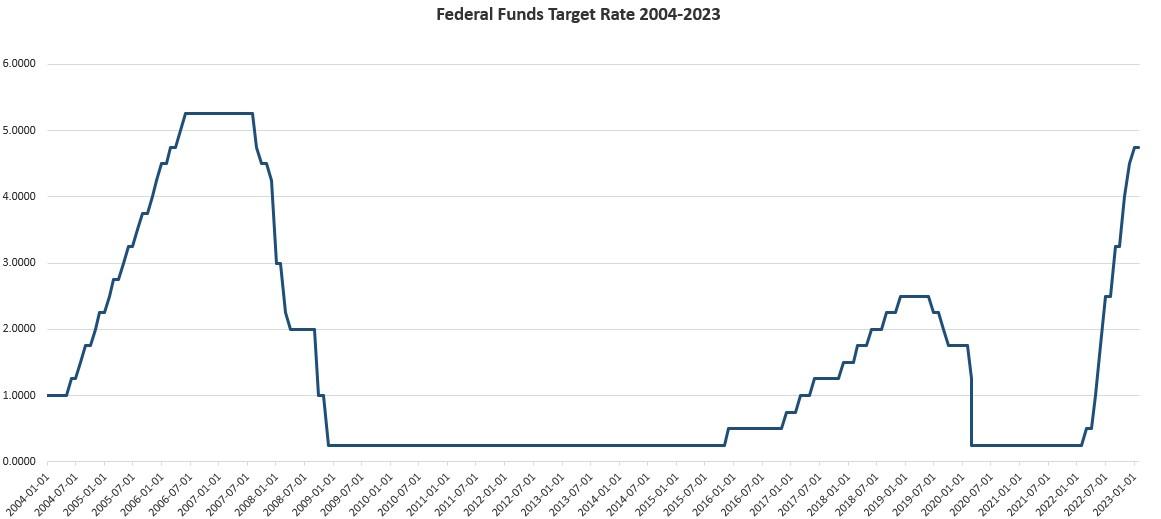
It's not especially a mystery why short-term interest rates are headed up fast, and why the money supply is decelerating. Since January 2022, the Fed has raised the target federal funds rate from 0.25 percent up to 4.75 percent.
This means fewer injections of Fed money into the market through open market operations. Moreover, although it has done very little to sizably reduce the size of its portfolio, the Fed has stopped adding to its portfolio through quantitative easing and allowed a small amount (about 6 percent of $8.9 trillion) to roll off.
It should be emphasized that it is not necessary for money supply growth to turn negative in order to trigger recession, defaults, and other economic disruptions. With recent decades marked by the Greenspan put, financial repression, and other forms of easy money, the Federal Reserve has inflated a number of bubbles and zombie enterprises that now rely on nearly constant infusions of new money to stay afloat. For many of these bubble industries, all that is necessary for a crisis is a slowing in money supply growth, brought on by rising interest rates or a confidence crisis.
Tags: Featured,newsletter


