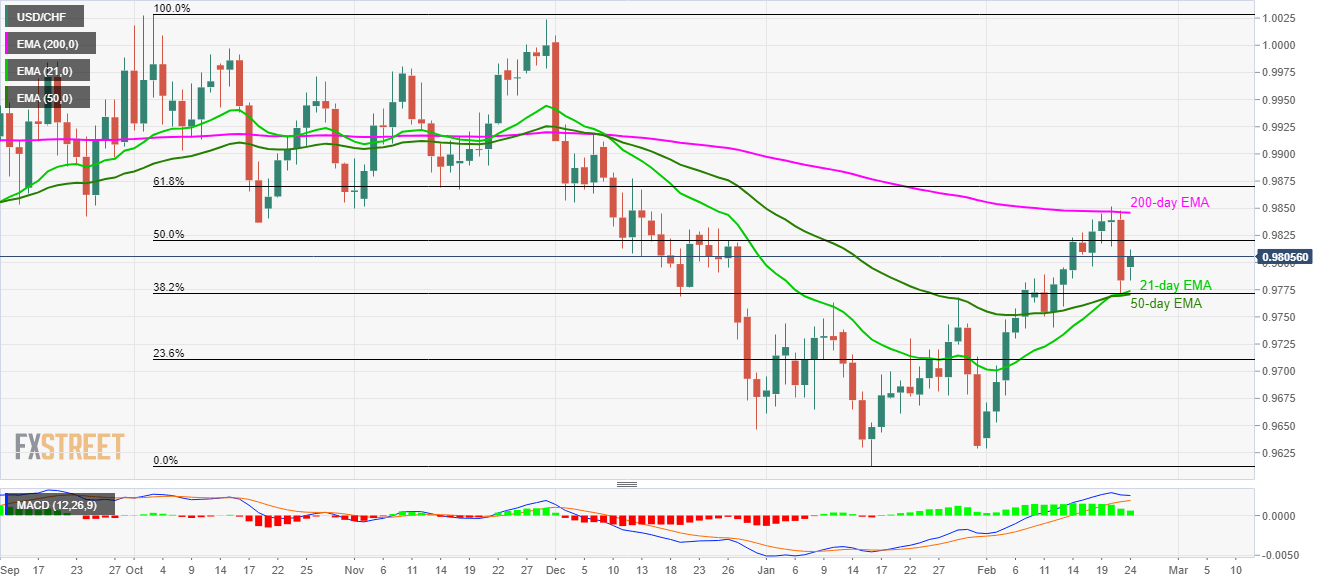
USD/CHF bounces off the short-term key support confluence comprising 21 and 50-day EMA as well as 38.2% Fibonacci retracement. 200-day EMA, 61.8% Fibonacci challenge buyers amid bullish MACD. USD/CHF registers 0.21% gains while taking the bids around 0.9805 during the early Monday. The pair recently reversed from 21/50-day EMA and 38.2% Fibonacci retracement of October 2019 to January 2020 declines. Also supporting the pullback are bullish signals from MACD. That said, the pair now aims to confront 50% Fibonacci retracement level of 0.9820 whereas a 200-day EMA level of 0.9845 becomes the tough nut to crack for buyers afterward. Should there be a sustained run-up beyond 0.9845, 61.8% Fibonacci retracement level of 0.9870 and 0.9900 will be on the bulls’ radars.
Topics:
Anil Panchal considers the following as important: 1) SNB and CHF, 1.) FXStreet on SNB&CHF, Featured, newsletter, USD/CHF
This could be interesting, too:
Mark Thornton writes The Great Chocolate Crisis of 2024
Mustafa Ekin Turan writes How EU Law Has Made the Internet Less Free for Everyone Else
Thomas J. DiLorenzo writes Attention mises.org Readers! Treat the Students in Your Life to The Best Week of Their Year
Octavio Bermudez writes Mises in Argentina: Lessons of the Past for Today
USD/CHF registers 0.21% gains while taking the bids around 0.9805 during the early Monday. The pair recently reversed from 21/50-day EMA and 38.2% Fibonacci retracement of October 2019 to January 2020 declines. Also supporting the pullback are bullish signals from MACD. That said, the pair now aims to confront 50% Fibonacci retracement level of 0.9820 whereas a 200-day EMA level of 0.9845 becomes the tough nut to crack for buyers afterward. Should there be a sustained run-up beyond 0.9845, 61.8% Fibonacci retracement level of 0.9870 and 0.9900 will be on the bulls’ radars. Alternatively, the pair’s daily closing below 0.9770/75 support confluence can divert sellers towards 0.9750/45 ahead of highlighting a 23.6% Fibonacci retracement level of 0.9710. |
USD/CHF daily chart(see more posts on USD/CHF, ) |
Trend: Pullback expected
Tags: Featured,newsletter,USD/CHF

