Summary:
According to the BLS, inflation in the category of “New Vehicles” has been practically non-existent the past 21 years.
Longtime readers know I’ve long turned a skeptical gaze at official calculations of inflation, offering real-world analyses such as The Burrito Index: Consumer Prices Have Soared 160% Since 2001 (August 1, 2016) and Burrito Index Update: Burrito Cost Triples, Official Inflation Up 43% from 2001 (May 31, 2018).
Official claims that grossly understate real-world inflation is a core feature of debt-serfdom and neofeudalism: we’re working harder and longer and getting less for our earnings every year, but this reality is obfuscated by official pronouncements that inflation is 2%–barely above zero.
Topics:
Charles Hugh Smith considers the following as important:
5) Global Macro,
Featured,
newsletter,
The United States
This could be interesting, too:
Nachrichten Ticker - www.finanzen.ch writes Die Performance der Kryptowährungen in KW 9: Das hat sich bei Bitcoin, Ether & Co. getan
Nachrichten Ticker - www.finanzen.ch writes Wer verbirgt sich hinter der Ethereum-Technologie?
Martin Hartmann writes Eine Analyse nach den Lehren von Milton Friedman
Marc Chandler writes March 2025 Monthly
According to the BLS, inflation in the category of “New Vehicles” has been practically non-existent the past 21 years.
Official claims that grossly understate real-world inflation is a core feature of debt-serfdom and neofeudalism: we’re working harder and longer and getting less for our earnings every year, but this reality is obfuscated by official pronouncements that inflation is 2%–barely above zero.
Meanwhile, quality and quantity are in permanent decline. New BBQ grills rust out in a few years, if not months, appliance paint is so thin a sponge and a bit of cleanser removes the micron-thick coating, and on and on in endless examples of the landfill economy, as new products are soon dumped in the landfill due to near-zero quality control and/or planned obsolescence.
In the guest post below, Bill looks at new car prices, and finds that official inflation for “new vehicles” from November 1983 to November 2013 measured only 43.8 percent… while actual car inflation (based on archived price records in Morris County, NJ) is 4.85 times higher than official CPI “new vehicle” inflation.
Prices for new cars sky-rocketed over 30 years (or did they?)
A lesson in ‘hedonic adjustments’
By Bill Rice, Jr.
In addition to grocery and household staples, the
Annual Price Survey of Morris County, NJ lists the prices of new cars for each year. I was curious to learn how the price of a car the year I graduated from high school (1983) compared to the price of a car 30 years later in 2013. (The MC Price Survey ended in 2014).
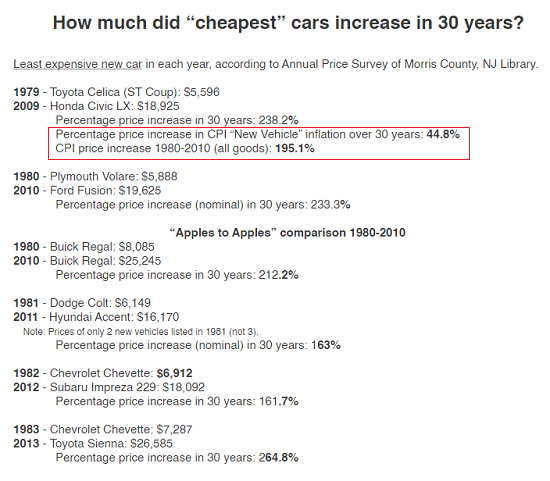
What did I learn? Well, I learned that car prices went up a LOT in 30 years. Between 1979-1983 the least expensive car available, at least from this price survey, averaged $6,366. By comparison, the least expensive car in 2009-2013 averaged $19,879. This is a nominal price increase of 212.3 percent.
Now here’s the head-scratcher. According to the BLS, inflation for all goods (CPI-U) from August 1983 to August 2013 increased by 133.4 percent — that is, far less than the sample of inexpensive cars from Morris County, NJ.
But that’s just part of the inflation story. The BLS also publishes indexes in the category of “new vehicles.” According to these indexes, inflation for “new vehicles” from November 1983 to November 2013 measured only 43.8 percent. That is, actual car inflation (based on archived price records in Morris County, NJ) is 4.85 times higher than official CPI “new vehicle” inflation.
How is such a huge discrepancy explained? Here, we detour into a discussion of
hedonic adjustments, an eye-glazing topic for some, but where the rubber meets the road in any contemporary analysis of inflation.
In the latter part of the 1990s, the Bureau of Labor Statistics (BLS) decided to adjust new vehicle prices (and the prices of many other products such as computers) for “quality.” The rationale for this “improved methodology” is that new cars are clearly superior to older cars.
For example, newer models often include features that weren’t standard in earlier times/car models. Presumably today’s cars last longer than yesterday’s cars, require fewer repairs and even include life-saving features like air bags. In short, we get a lot more car for the buck than we did in 1983.
| While the 2010 Buick Regal is certainly a better car than the 1980 Regal, is it really $17,160 better? Or: could I ask for a Regal with “just the basic stuff” that was standard in the 1980 version and then ask my sales person, “Can you knock $17,000 off the sticker price?” I could ask, I guess, but the answer would be no. (Another person, I discovered, asked the same-type questions).
While the merits of hedonic adjustments can be debated, what can’t be debated is the hard data produced by the BLS. Back in the day – before hedonic adjustments – new vehicles did experience price inflation, documented in the steep incline of CPI price indices for new vehicles from 1974 into 1997. However, beginning in March 1997, this graph suddenly pivots south. In recent decades, new vehicle prices have essentially been flat.
Indeed, in more years than not, the CPI index for new vehicles was negative, representing price deflation for new vehicles.
Anyway, I was not surprised to discover that a new car cost a whole lot more in 2013 than it did in 1983. I was, however, surprised to discover that, according to the BLS, inflation in the category of “New Vehicles” has been practically non-existent the past 21 years of my life.
See price comparisons below: |
How much did "cheapest" cars increase in 30 years? - Click to enlarge |
Tags:
Featured,
newsletter

