The Gift that Keeps on Giving Every year a certain stock market phenomenon is said to recur, anticipated with excitement by investors: the Santa Claus rally. It is held that stock prices typically rise quite frequently and particularly strongly just before the turn of the year. I want to show you the Santa Claus rally in the German DAX Index as an example. Price moves are often exaggerated in the German stock market, which leads to quite pronounced – and hence profitable – seasonal trends. Unbeknown to many, Santa Claus paid a high price for enriching investors - Click to enlarge Recurring trends can be discerned at a glance on a seasonal chart The chart below is not a standard chart that depicts a price trend
Topics:
Dimitri Speck considers the following as important: Debt and the Fallacies of Paper Money, Featured, newslettersent, The Stock Market
This could be interesting, too:
Nachrichten Ticker - www.finanzen.ch writes Die Performance der Kryptowährungen in KW 9: Das hat sich bei Bitcoin, Ether & Co. getan
Nachrichten Ticker - www.finanzen.ch writes Wer verbirgt sich hinter der Ethereum-Technologie?
Marc Chandler writes March 2025 Monthly
Mark Thornton writes Is Amazon a Union-Busting Leviathan?
The Gift that Keeps on GivingEvery year a certain stock market phenomenon is said to recur, anticipated with excitement by investors: the Santa Claus rally. It is held that stock prices typically rise quite frequently and particularly strongly just before the turn of the year. I want to show you the Santa Claus rally in the German DAX Index as an example. Price moves are often exaggerated in the German stock market, which leads to quite pronounced – and hence profitable – seasonal trends. |
|
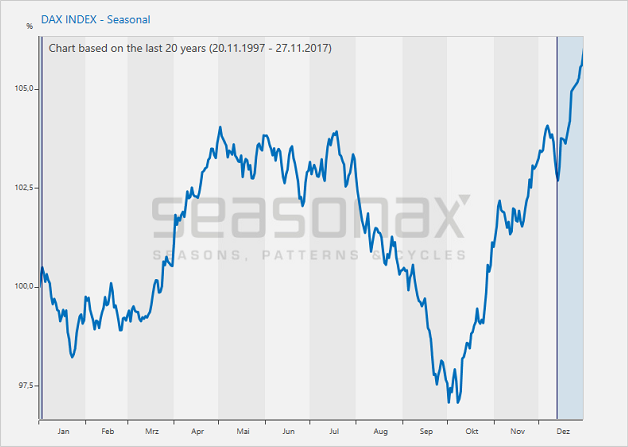
Recurring trends can be discerned at a glance on a seasonal chartThe chart below is not a standard chart that depicts a price trend over a specific time period. Rather, this seasonal chart shows the typical seasonal pattern of the German DAX Index. It illustrates the average returns generated by the index in the course of a year over the past 20 years. The horizontal axis shows the time of the year, the vertical axis shows the price information indexed to 100. |
|
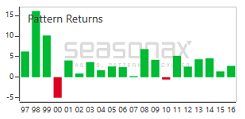
The Santa Claus rally starts in mid-December!The positive seasonal period near the end of the year is highlighted in dark blue on the chart. The Santa Claus rally in the DAX Index begins on December 13 and typically lasts until January 02 of the next year. A Disproportionate Gain in Stock PricesThe average return achieved in the time period from December 13 to January 02 amounted to 3.66 percent. This gain was generated in just 19 calendar days. Thus the Santa Claus rally on average generated an annualized gain of 99.62 percent! For comparison: in the rest of the time the annualized gain of the DAX amounted to just 1.86 percent. In short, the seasonal trend around the Christmas holidays is quite extraordinary. Prices Rose in 90% of all CasesThis raises the question whether this is a robust result or if it is a statistical artifact attributable to a few outliers. Let us take a closer look at the individual years underlying the pattern. The following bar chart shows how prices behaved in the time period from December 13 to January 02 in every year since 1997. Green bars indicate years generating gains, red bars indicate years in which losses occurred. As the breakdown illustrates, the green bars clearly dominate both in frequency and extent. The Santa Claus rally took place in 18 of the past 20 years, with the largest gain amounting to 16.13 percent (achieved in 1998). By contrast, there were just 2 years in which the Santa Claus rally failed to happen. The largest loss was recorded in 2000 and amounted to 4.99 percent. In other words, individual outliers are not responsible for generating the market’s strength close to the end of the year. In fact, the pattern is quite stable from a statistical perspective. What causes the market’s strength at the end of the year though? |
Pattern Returns, 1997 - 2016 |
There are Compelling Reasons for the Year-End Rally in the Stock MarketOne often cited reason for the stock market rally at the end of the year is window dressing by investment funds – i.e., investment funds support prices at year-end in order to prettify their results – which has the purely coincidental side-effect of boosting bonus payments, which are often calculated at the turn of the year. Less obvious, often psychological reasons, are probably more a important factor though. These include the fact that people often take stock at the end of the year and position themselves for the new year. In addition, there is the statistically significant holiday effect, which demonstrably tends to lead to rallies on occasion of other holidays as well. During Christmas time the strong desire to buy things (such as presents) appears to be spilling over into the stock market as well. Christmas is after all a time of giving. So perhaps it should be no surprise that the stock market is often rewarding investors generously at this time of the year. |
|
The Santa Claus rally in other marketsIf you want to find out how pronounced the Santa Claus rally in your favorite market instruments is, visit my free-of-charge website www.seasonalcharts.com or call up the Seasonax app on your Bloomberg terminal or in Thomson-Reuters Eikon. As an aside: there are never any guarantees in the markets, but you can certainly let the probabilities work in your favor! PS: Treat yourself to a present with the seasonal patterns in the stock market! |
Tags: Featured,newslettersent,The Stock Market

