Summary:
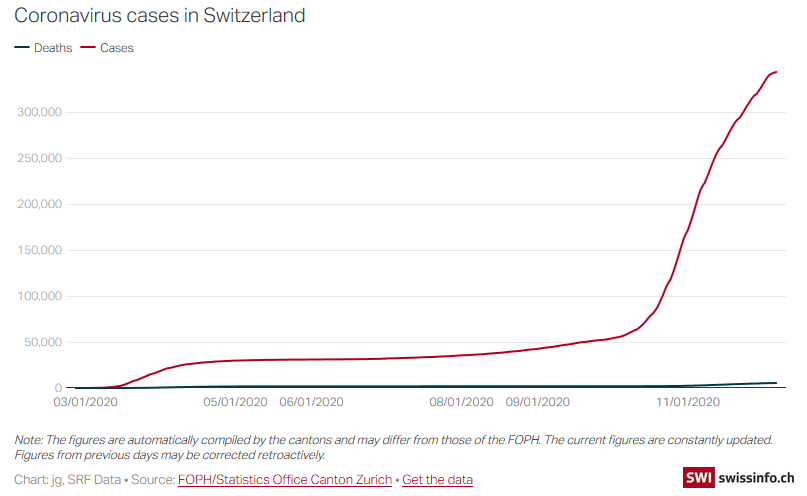
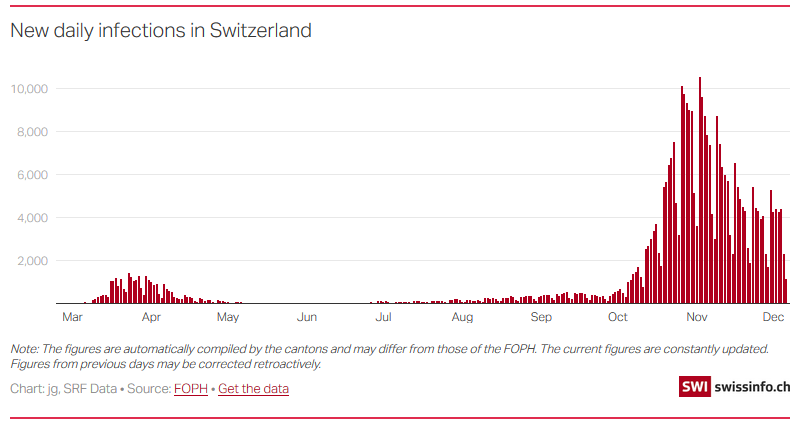
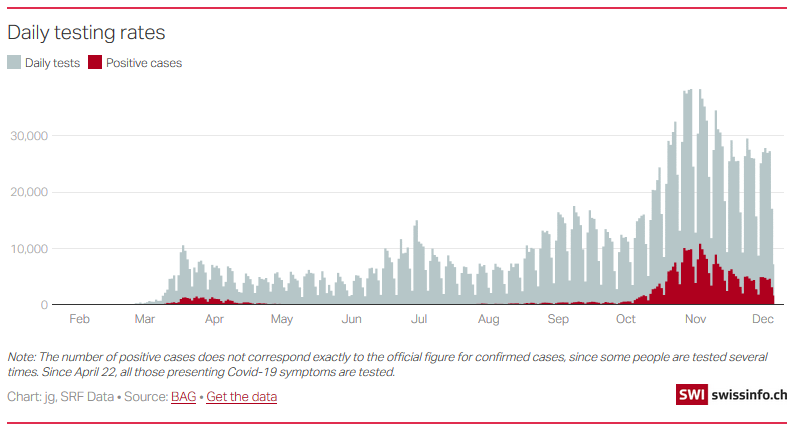
Here is an overview of the most important Swiss-related coronavirus data and graphs, which are updated automatically. How fast is the coronavirus spreading in Switzerland? We publish a series of graphs on this page, which are constantly updated as new data becomes available. This only happens once a day from Monday to Friday. The sources and the methodology behind the graphs can be found at the end of the article. In order to assess the current situation in Switzerland, various data points can be used. The new infections reported daily are often quoted. For the new infections data to be meaningful and for the situation to be correctly assessed, sufficient tests are needed. The available data on the tests show that testing regimes of the cantonal authorities
Topics:
Swissinfo considers the following as important: 3) Swiss Markets and News, 3.) Swiss Business and Economy
This could be interesting, too:
Swissinfo writes Corporate efforts to expand access to medicine stumble
Swissinfo writes Swiss banks failing environment, says WWF
Swissinfo writes How a Swiss farming simulator became a global gaming phenomenon
Swissinfo writes Nestlé aims to boost brand in search of growth
Here is an overview of the most important Swiss-related coronavirus data and graphs, which are updated automatically.
| How fast is the coronavirus spreading in Switzerland? We publish a series of graphs on this page, which are constantly updated as new data becomes available. This only happens once a day from Monday to Friday. The sources and the methodology behind the graphs can be found at the end of the article. | |
| In order to assess the current situation in Switzerland, various data points can be used. The new infections reported daily are often quoted. | |
| For the new infections data to be meaningful and for the situation to be correctly assessed, sufficient tests are needed. The available data on the tests show that testing regimes of the cantonal authorities are subject to fluctuations. | |
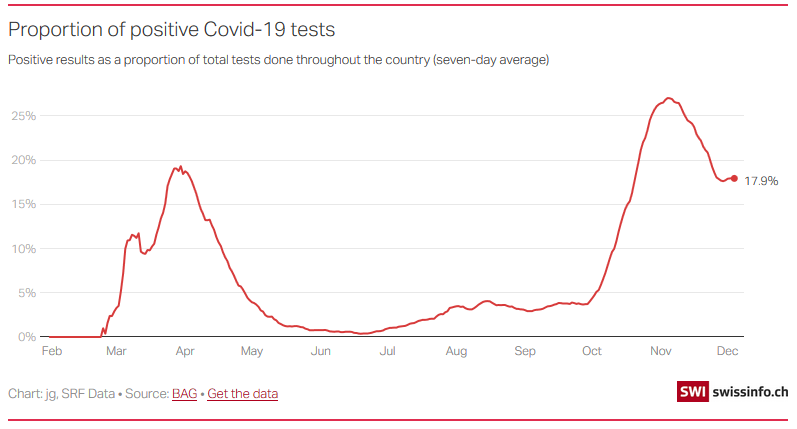
| The proportion of positive results from the total tests carried out is a good indicator of whether the officially published case numbers are an accurate picture of the overall situation. As long as this proportion does not climb above 5%, the WHO says, then a large proportion of cases are being recorded. | |
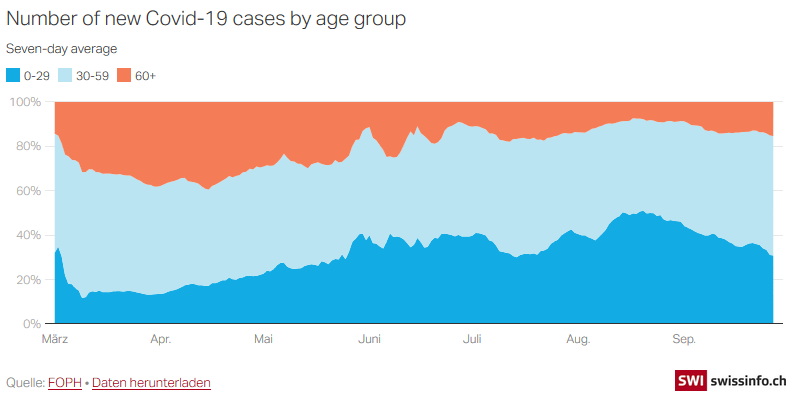
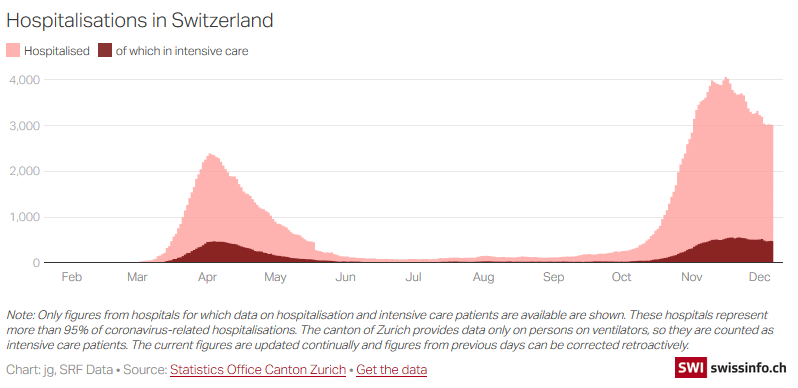
| Who is currently infected? This question is important, as the age structure of those currently infected can give an indication of what to expect in hospitals. As a rule of thumb, the younger the infected persons, the milder the disease. This was one of the reasons why the number of cases increased in late summer, but hospital beds remained empty. In the meantime, however, people from more vulnerable age groups are becoming infected again. The following chart shows the proportion of newly reported cases in the various age groups. | |
| If new infections of older age groups increase, the number of hospital beds occupied by Covid-19 cases can be expected to also increase about two to three weeks later. | |
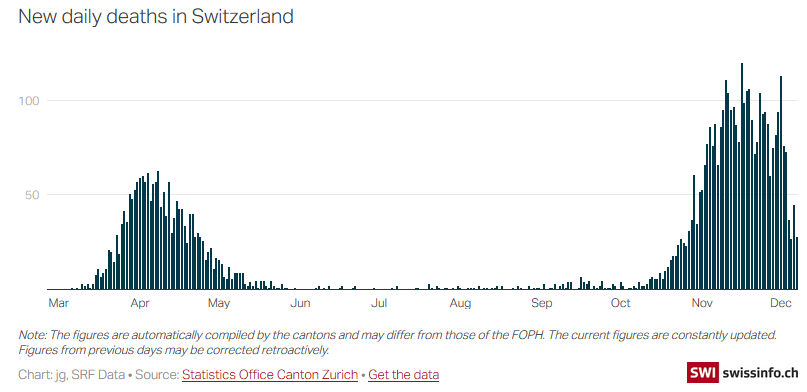
| A good indicator of the end of a wave is the decrease in daily reported deaths related to Covid-19. Because the FOPH has a narrower definition than certain cantons, the cantonal figures are used here. According to several cantonal physicians, these figures better reflect the current situation. | |
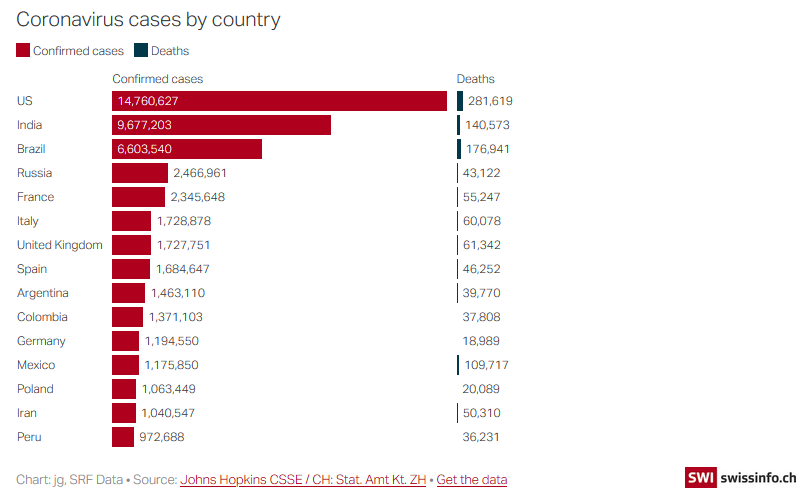
| For an international comparison we use data from Johns Hopkins University. |
Tags:

